Originalfil(1 813 × 1 088 pixlar, filstorlek: 371 kbyte, MIME-typ: image/png)

Sammanfattning

Expansion of the most recent 9 kyr

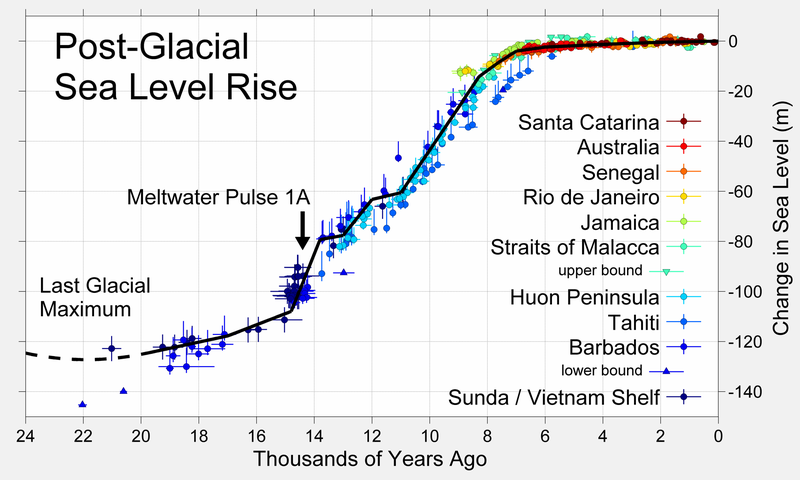
This figure shows sea level rise the end of the last glacial episode based on data from Fleming et al. 1998, Fleming 2000, and Milne et al. 2005. These papers collected data from various reports and adjusted them for subsequent vertical geologic motions, primarily those associated with post-glacial continental and hydroisostatic rebound. The first refers to deformations caused by the weight of continental ice sheets pressing down on the land the latter refers to uplift in coastal areas resulting from the increased weight of water associated with rising sea levels. Because of the latter effect and associated uplift, many islands, especially in the Pacific, experienced higher local sea levels in the mid-Holocene than they do today. Uncertainty about the magnitude of these corrections is the dominant uncertainty in many measurements of sea level change.

The black curve is based on minimizing the sum of squares error weighted distance between this curve and the plotted data. It was constructed by adjusting a number of specified tie points, typically placed every 1 kyr but at times adjusted for sparse or rapidly varying data. A small number of extreme outliers were dropped. Some authors propose the existence of significant short-term fluctuations in sea level such that the sea level curve might oscillate up and down about this ~1 kyr mean state. Others dispute this and argue that sea level change has largely been a smooth and gradual process. However, at least one episode of rapid deglaciation, known as meltwater pulse 1A, is agreed upon, and is indicated on the plot. A variety of other accelerated periods of deglaciation have been proposed (i.e. meltwater pulse 1B, 1C, 1D, 2, 3...), but it is unclear whether these actually occurred or merely reflect misinterpretation of difficult measurements. No other events are evident in the data presented above.

The lowest point of sea level during the last glaciation is not well constrained by observations (shown here as a dashed curve), but is generally argued to be approximately 130 ± 10 m below present sea level and to have occurred at approximately 22 ± 3 thousand years ago. The time of lowest sea level is more or less equivalent to the Last Glacial Maximum. Prior to this time, ice sheets were still increasing in size, so sea level had been decreasing almost continuously for approximately 100,000 years.

Copyright

This figure was prepared by Robert A. Rohde from published data, and is incorporated into the Global Warming Art project.

Image from Global Warming Art
This image is an original work created for Global Warming Art. Please refer to the image description page for more information.
GNU head Tillstånd ges att kopiera, distribuera och/eller modifiera detta dokument under villkoren i GNU Free Documentation License, Version 1.2 eller senare version publicerad av Free Software Foundation, utan oföränderliga avsnitt, framsidestexter eller baksidestexter. En kopia av licensen ingår i avsnittet GNU Free Documentation License.
w:sv:Creative Commons
erkännande dela lika
Denna fil har gjorts tillgänglig under licensen Creative Commons Erkännande-Dela Lika 3.0 Generisk
Du är fri:
  • att dela – att kopiera, distribuera och sända verket
  • att remixa – att skapa bearbetningar
På följande villkor:
  • erkännande – Du måste ge lämpligt erkännande, ange en länk till licensen och indikera om ändringar har gjorts. Du får göra det på ett lämpligt sätt, men inte på ett sätt som antyder att licensgivaren stödjer dig eller din användning.
  • dela lika – Om du remixar, transformerar eller bygger vidare på materialet måste du distribuera dina bidrag under samma eller en kompatibel licens som originalet.
Detta licenstillägg lades till till denna fil som en del av GFDL:s licensuppdatering.


References

  • Fleming, Kevin, Paul Johnston, Dan Zwartz, Yusuke Yokoyama, Kurt Lambeck, and John Chappell (1998). "Refining the eustatic sea-level curve since the Last Glacial Maximum using far- and intermediate-field sites". Earth and Planetary Science Letters 163 (1-4): 327-342. doi:10.1016/S0012-821X(98)00198-8
  • Fleming, Kevin Michael (2000) Glacial Rebound and Sea-level Change Constraints on the Greenland Ice Sheet, Australian National University PhD Thesis
  • Milne, Glenn A., Antony J. Long and Sophie E. Bassett (2005). "Modelling Holocene relative sea-level observations from the Caribbean and South America". Quaternary Science Reviews 24 (10-11): 1183-1202. doi:10.1016/j.quascirev.2004.10.005


Denna bild (eller alla bilder i denna artikel eller kategori) bör återskapas med hjälp av vektorgrafik som en SVG-fil. Detta har flera fördelar; se Commons:Media for cleanup för mer information. Om det redan existerar en SVG-version av denna bild, var vänlig och lägg upp den. Efter att en SVG-version lagts upp, ersätt denna mall med {{vector version available|nytt bildnamn.svg}} på denna sida.

Bildtexter

Ingen bildtext har definierats

Objekt som porträtteras i den här filen

motiv

image/png

Filhistorik

Klicka på ett datum/klockslag för att se filen som den såg ut då.

Datum/TidMiniatyrbildDimensionerAnvändareKommentar
nuvarande19 mars 2019 kl. 01.36Miniatyrbild för versionen från den 19 mars 2019 kl. 01.361 813 × 1 088 (371 kbyte)Dragons flightHigher resolution version
25 november 2016 kl. 19.26Miniatyrbild för versionen från den 25 november 2016 kl. 19.26526 × 359 (19 kbyte)A876edited to correct spelling. (also OptiPNG.)
27 december 2005 kl. 04.20Miniatyrbild för versionen från den 27 december 2005 kl. 04.20526 × 359 (23 kbyte)AngrenseSea level variation during the last post-glacial period. Source:English version of Wikipedia.

Följande 3 sidor använder den här filen:

Global filanvändning

Följande andra wikier använder denna fil:

Visa mer globalt användande av denna fil.
Metadata